Thank-you for visiting this page. We have assembled this information in an effort to keep you informed with the most recent and relevant.
In a market, such as this, where there is a lot of competition in respect to listings, it is very important to have someone who is knowledgeable and prepares you well to navigate the challenges (ex. Being priced appropriately). Here at McGarr Realty we ensure we are positioning our clients for as successful a transaction as possible, while being mindful to provide them an extraordinary Real Estate experience overall!
We would be honoured to assist you in navigating your Real Estate needs, so please do not hesitate to reach out!
There are a few things for you to know:
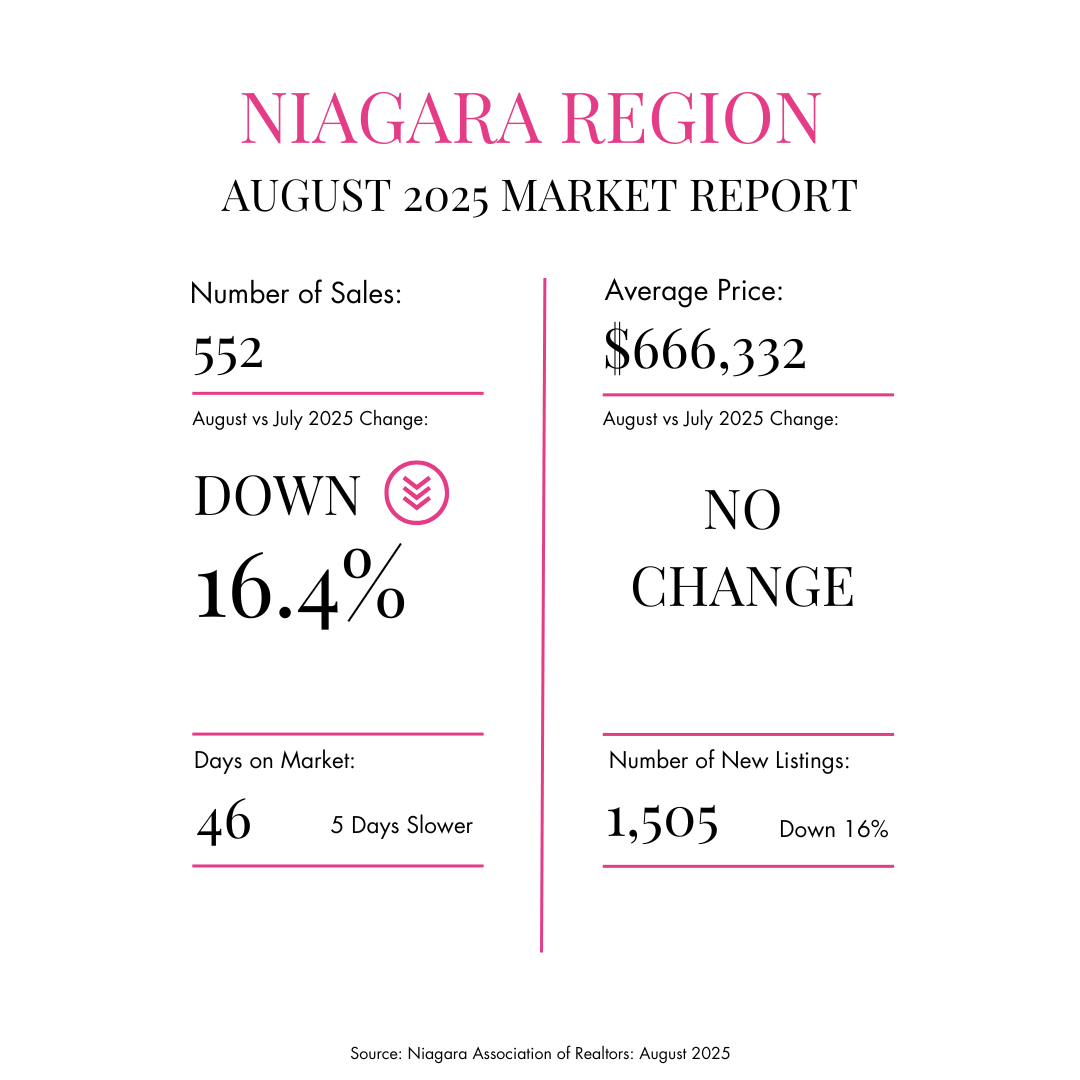
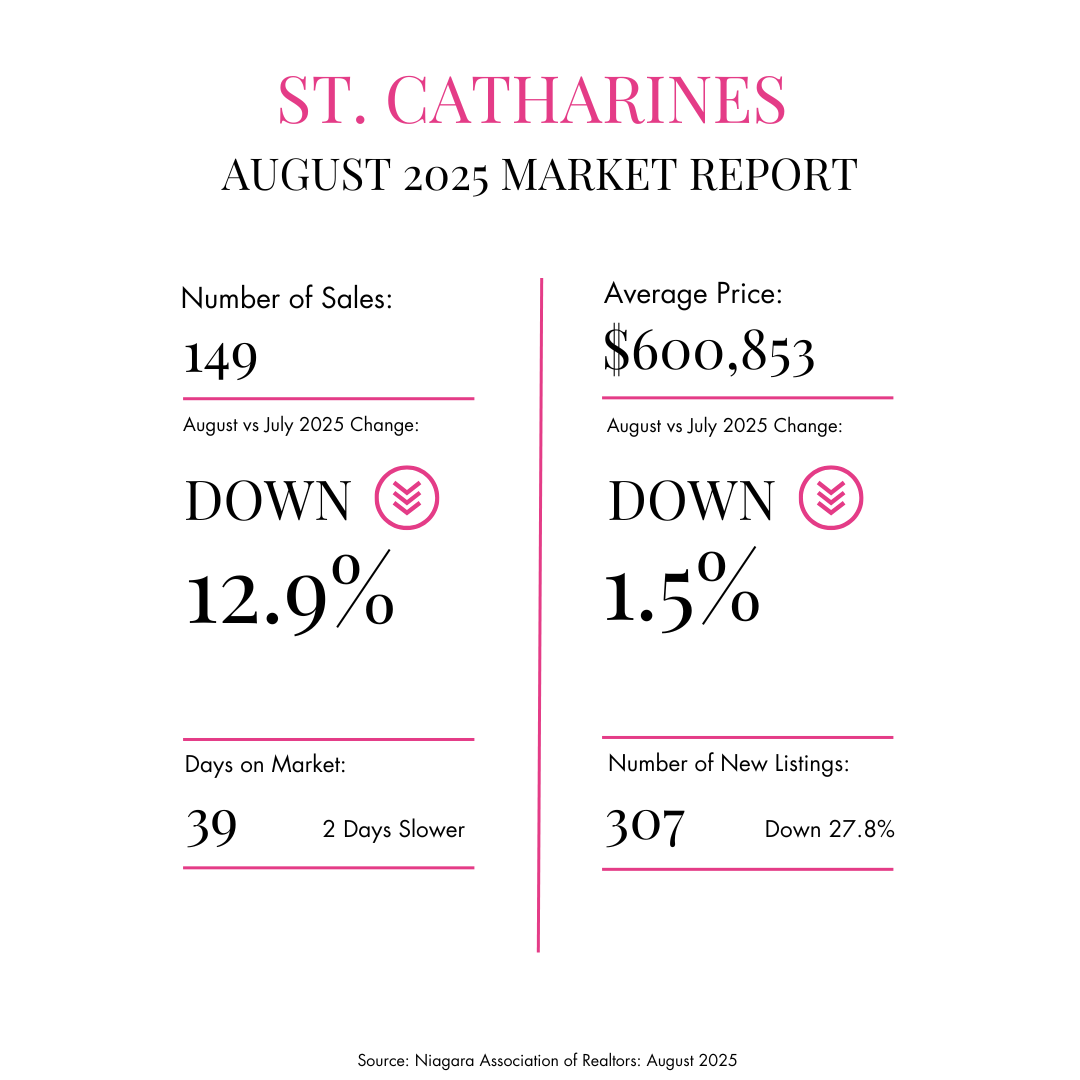
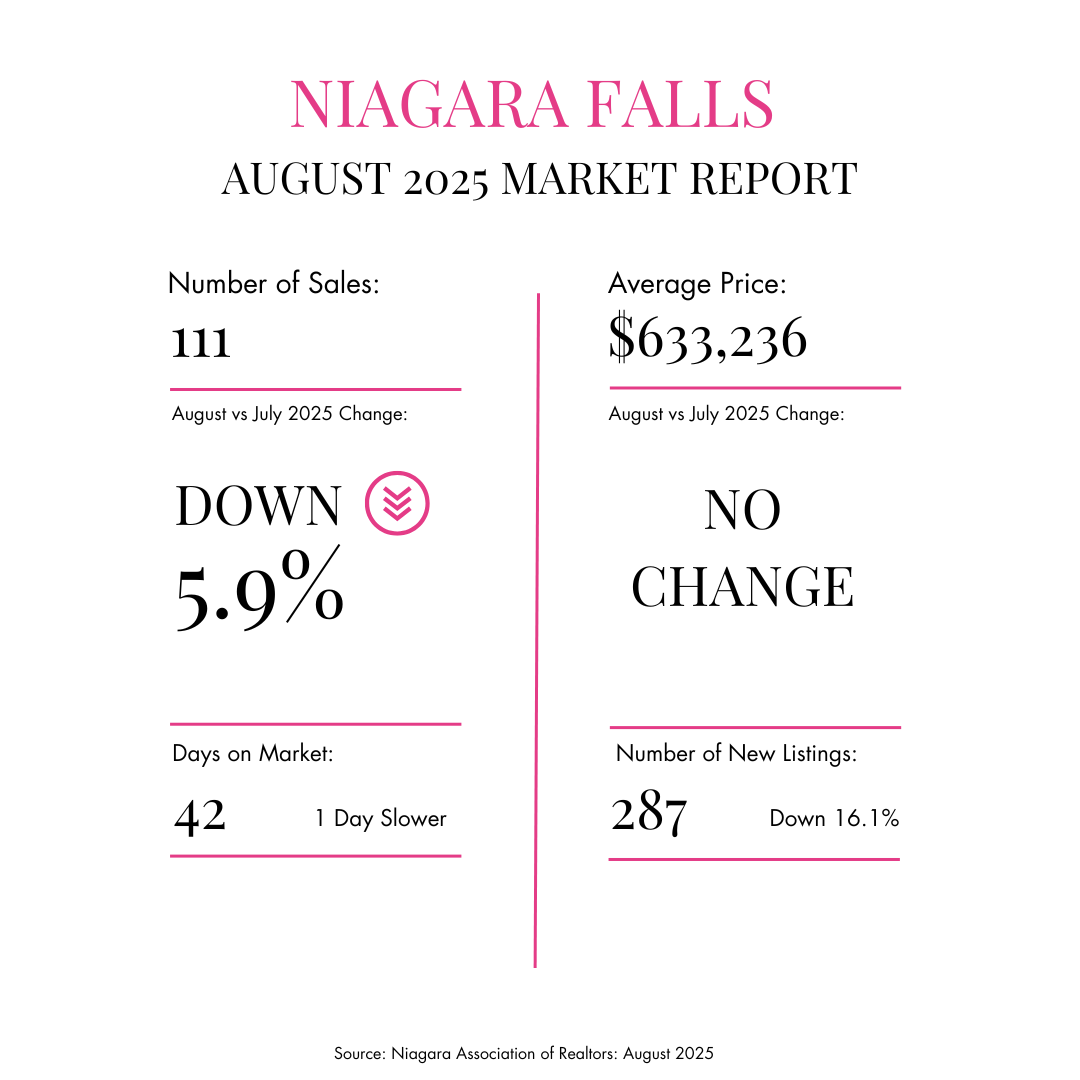
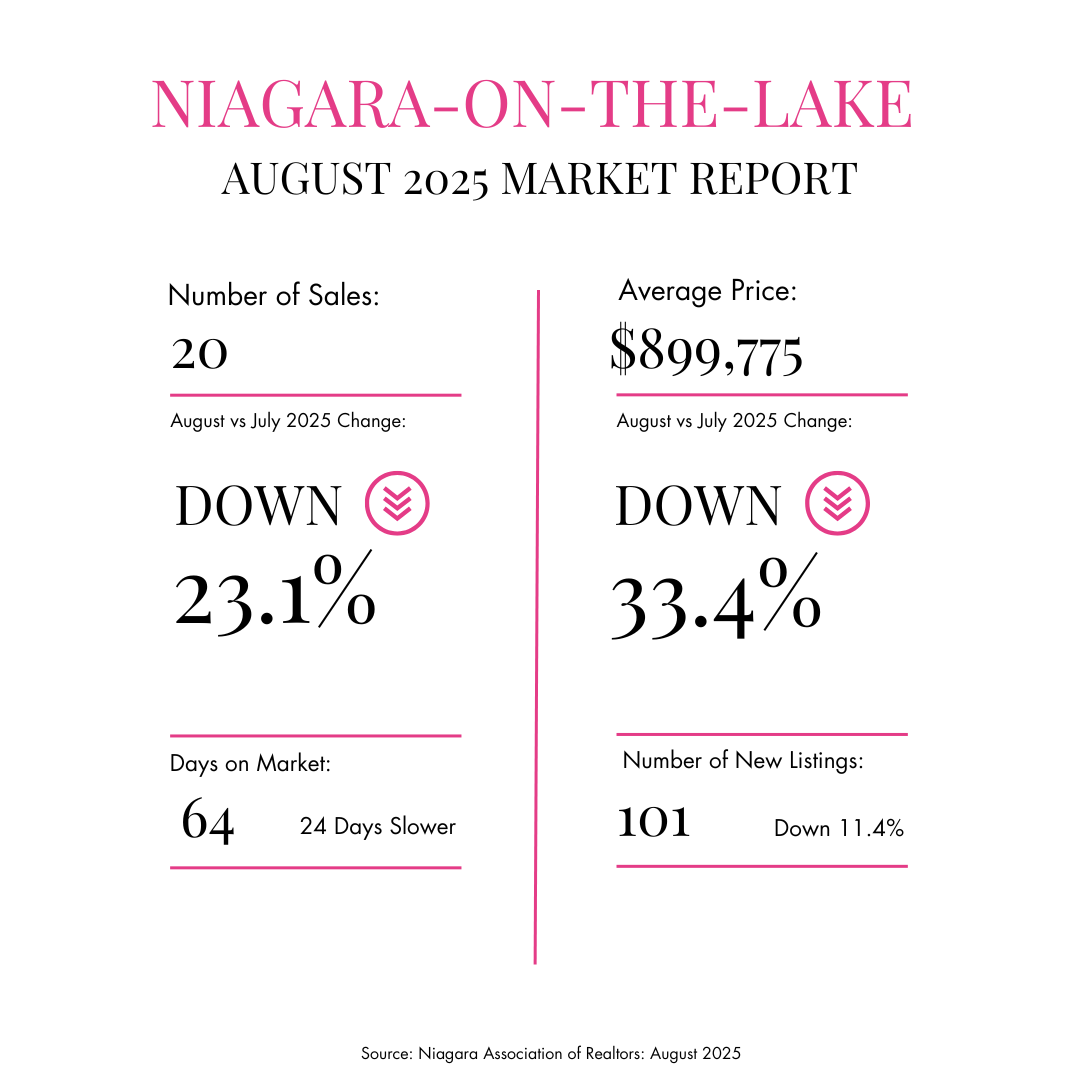
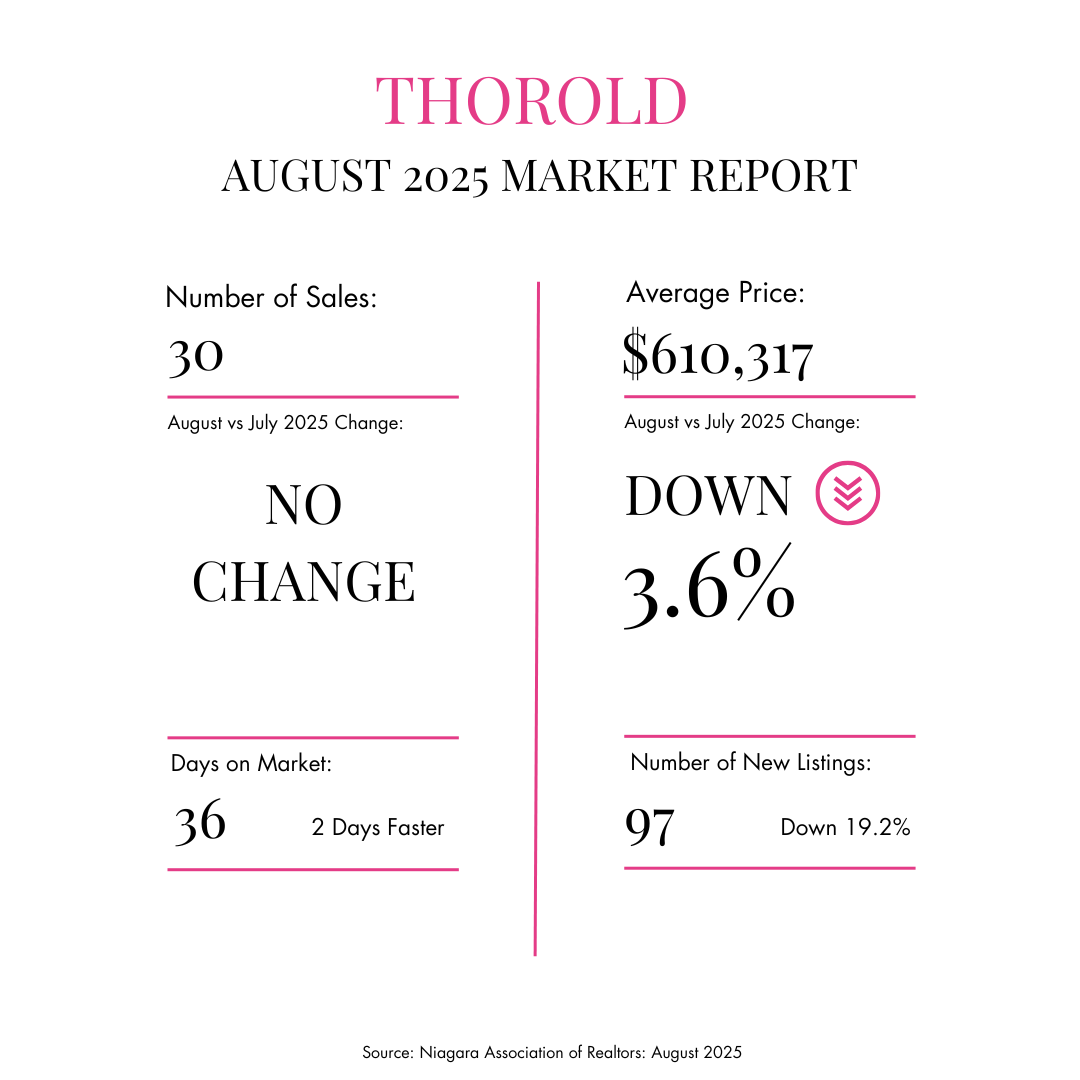
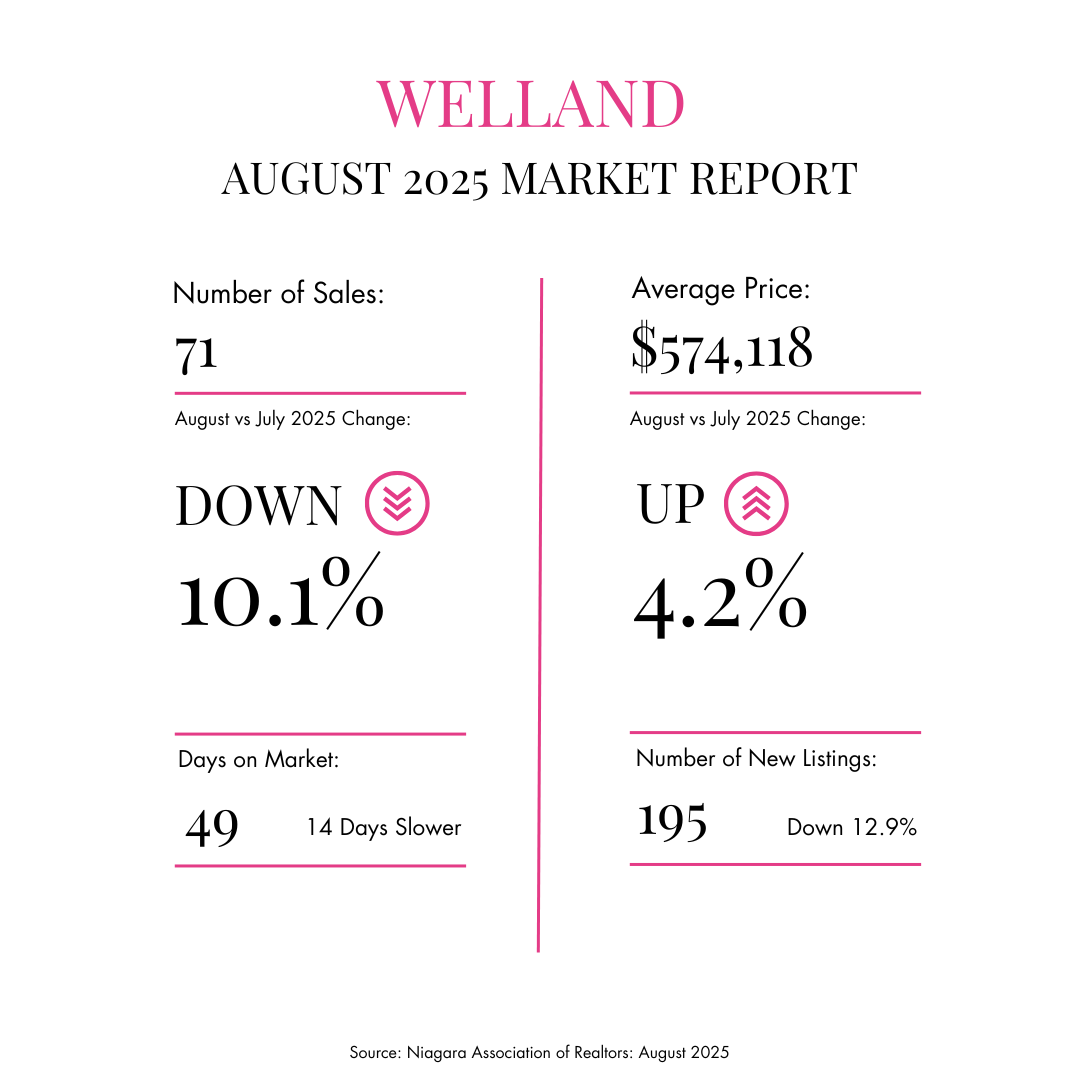
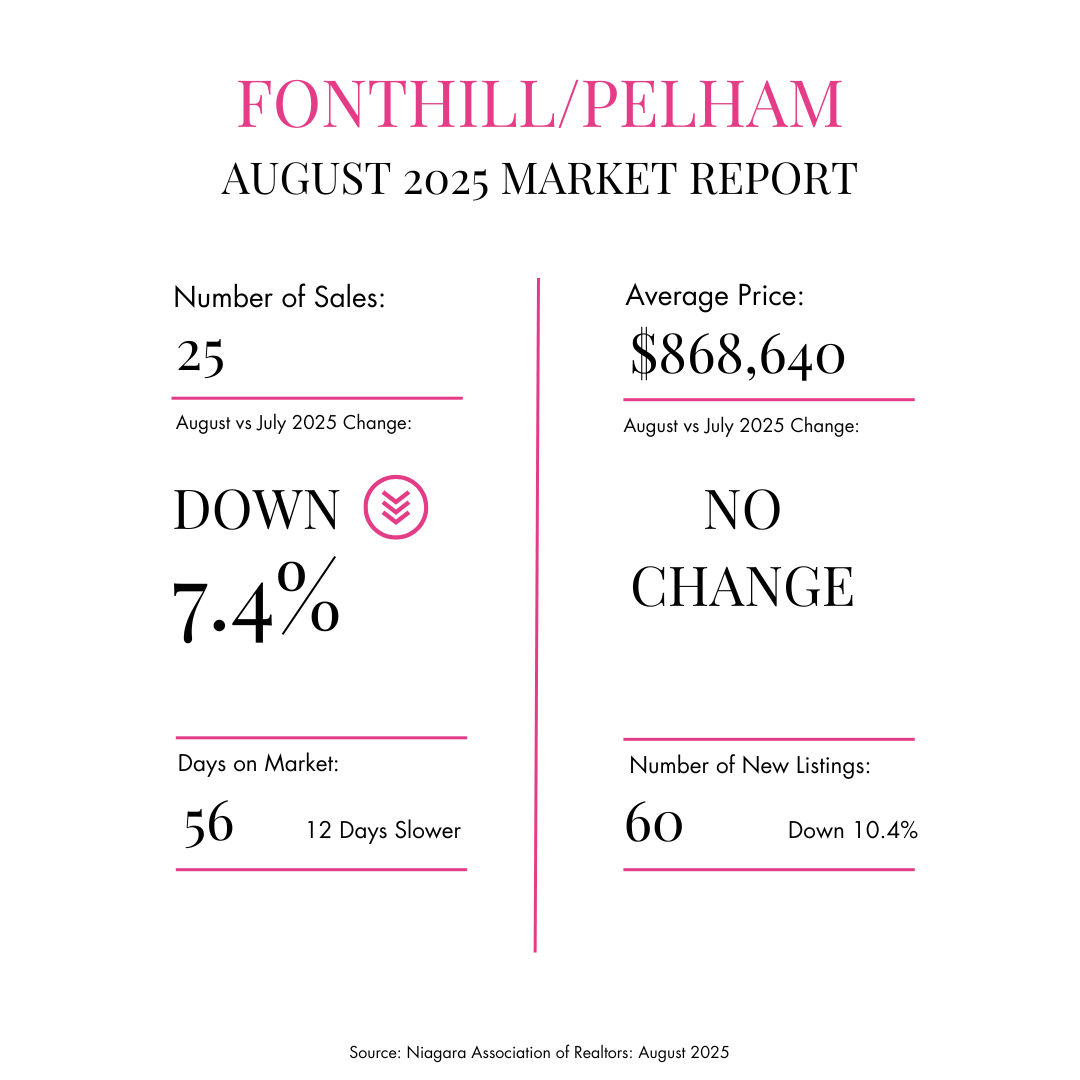
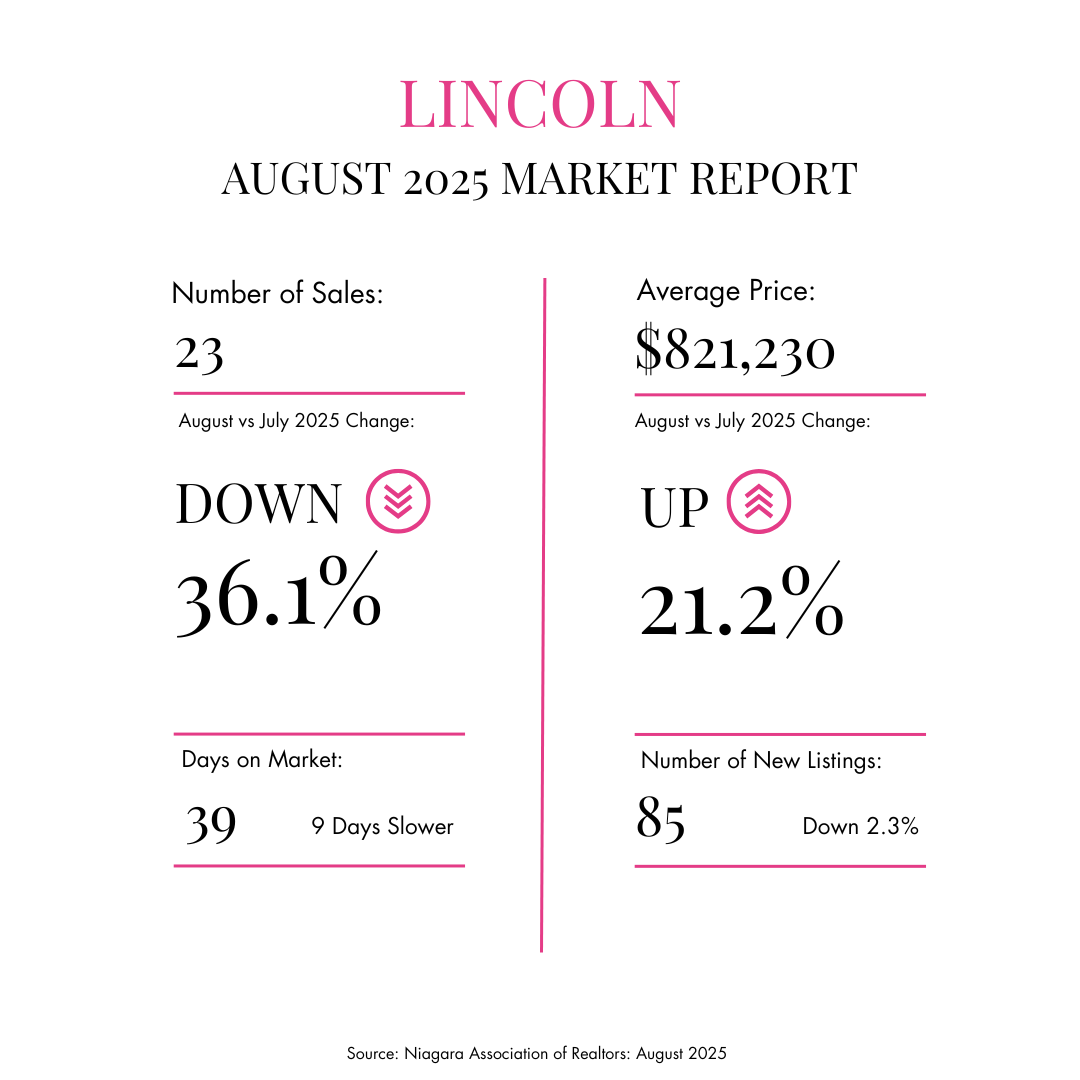
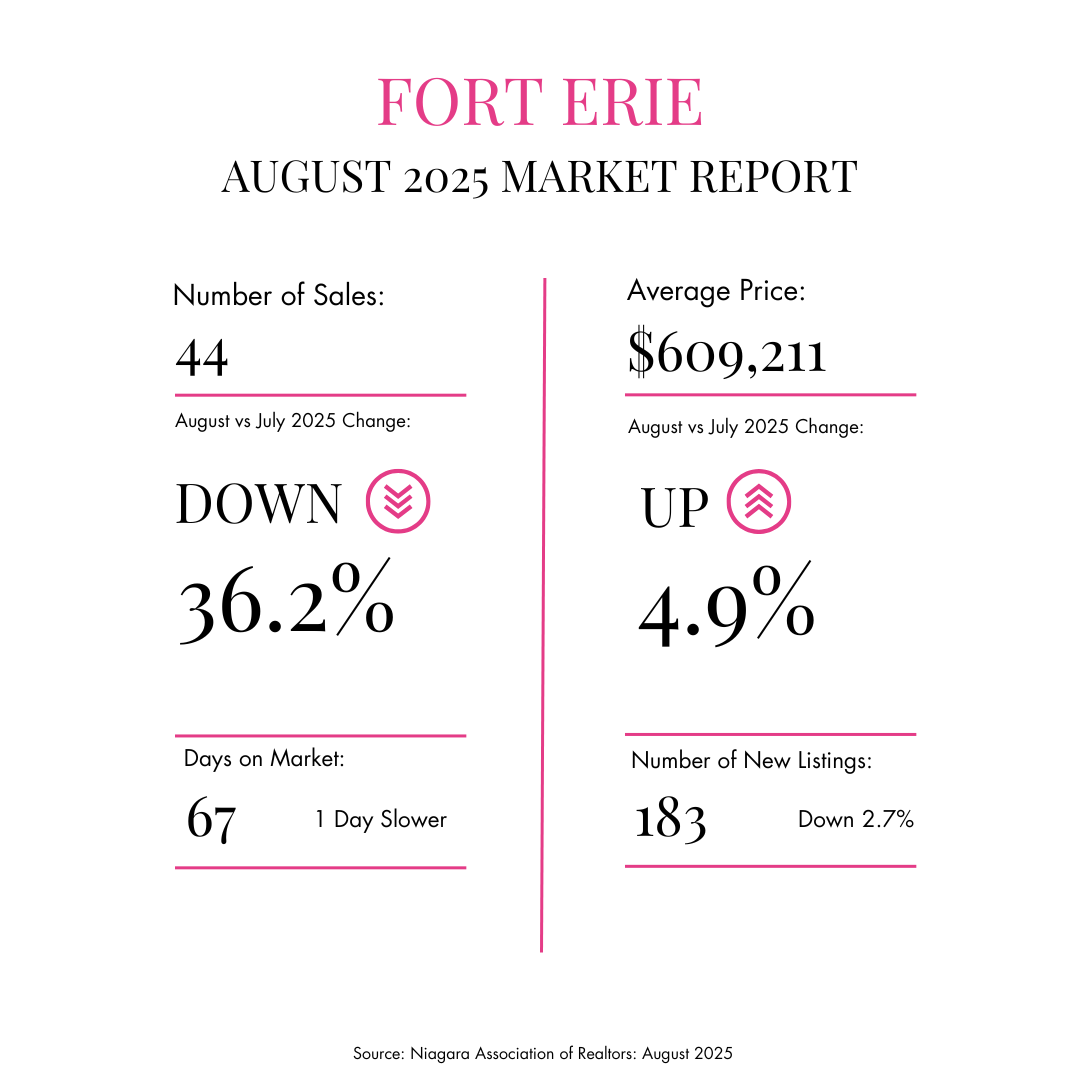
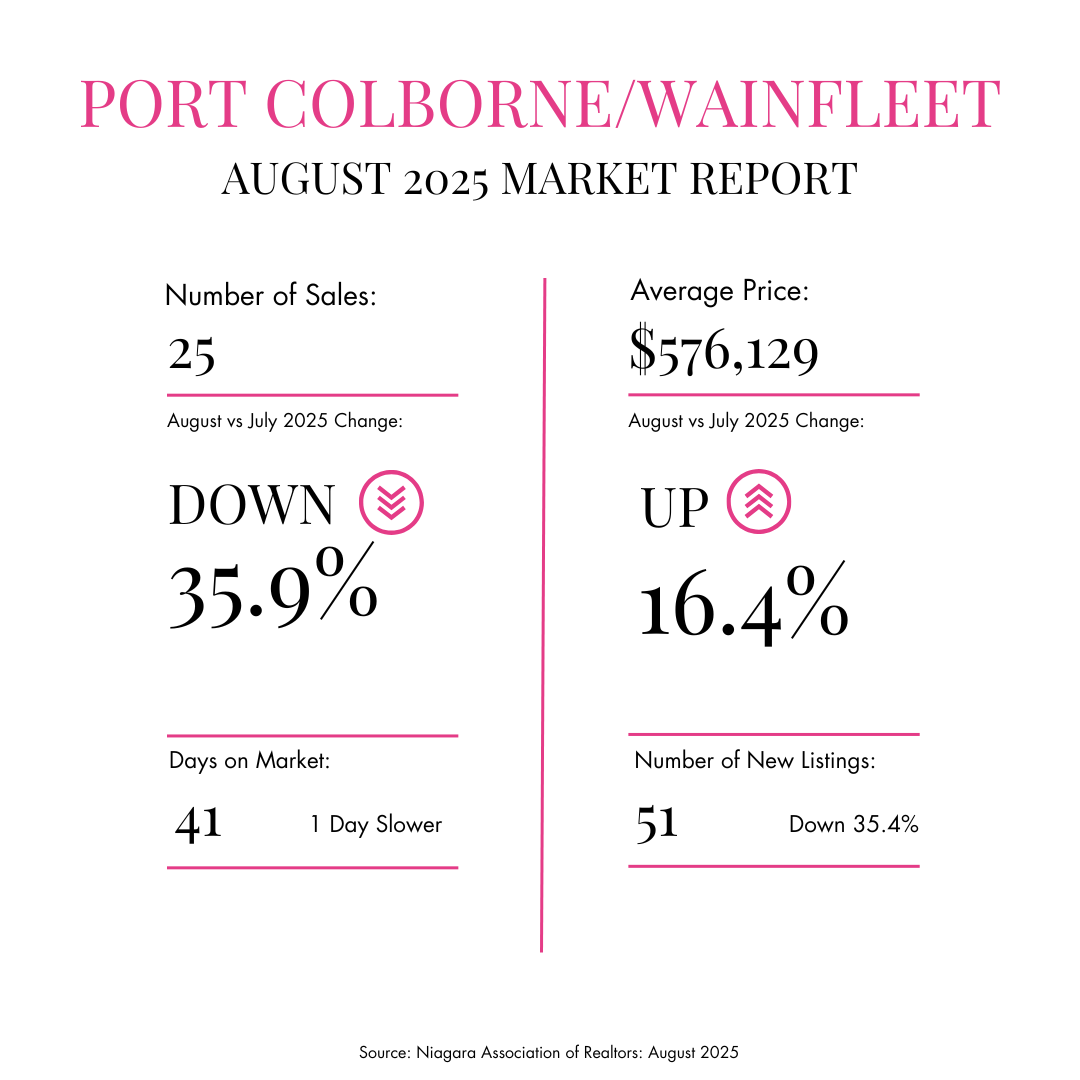
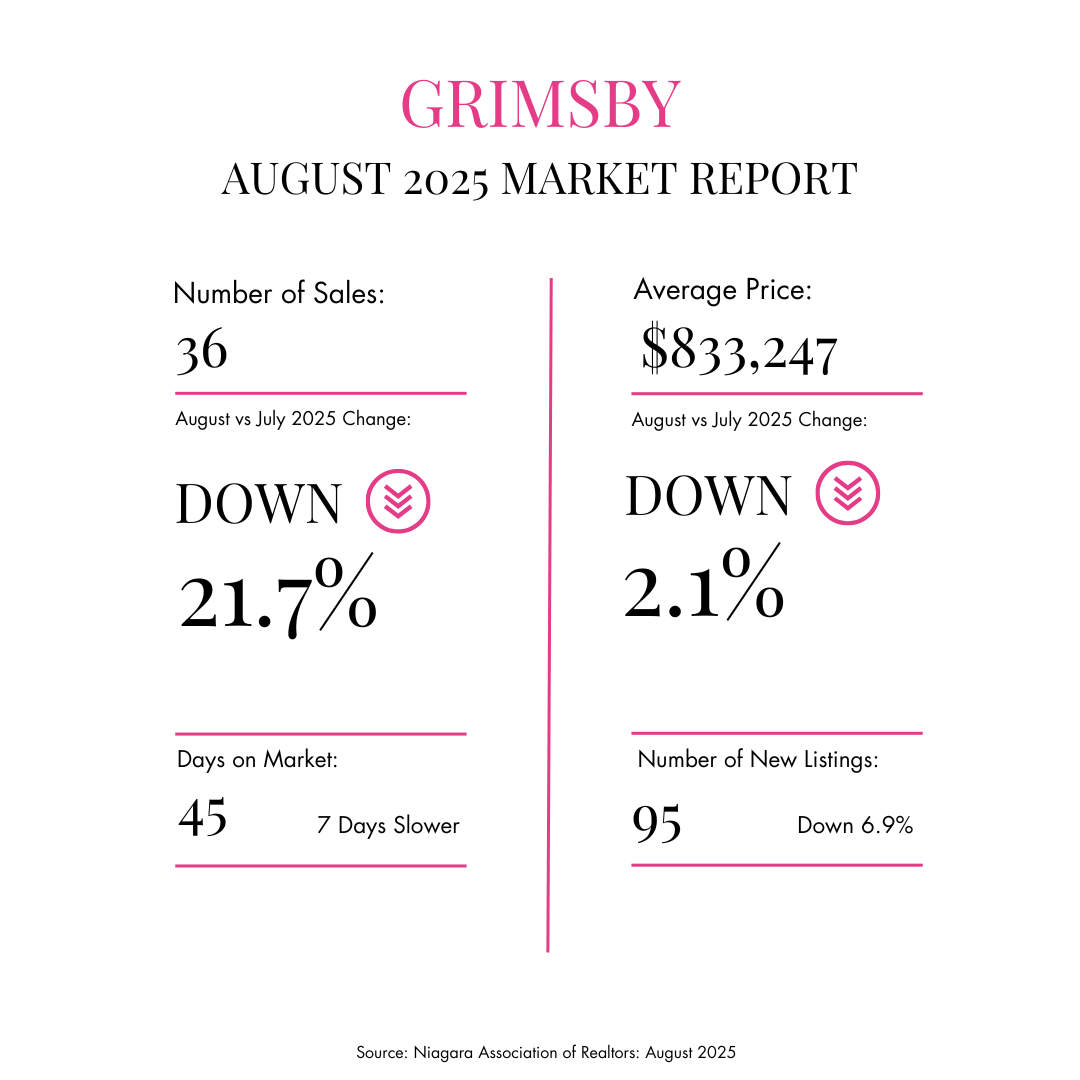
Again, we hope you have found this helpful. We will continue to update all of the above as we move through the coming weeks and months.
Your feedback, thoughts or inquiries are always welcome.
You can contact us here.
Most importantly, take good care and be safe.
The McGarr Team.
The Latest