A changing real estate market is one of the certainties in life that can be guaranteed. Looking back over the last 20 years, the real estate market in Niagara has behaved predictably, for the most part. By that, we tended to see value increases by single digit percentages, consistent sale to list price ratios, and days on the market, that largely resembled the previous year. It could best be described as a steady, rolling wave.
What was not predictable was the perfect storm of 2016 and 2017. The local REALTOR® community had been talking for years about the affordability of Niagara in comparison to other similar communities. We saw the slow-moving trend come down the QEW city by city from the GTA to Stoney Creek. Competing offers were a daily occurrence in a market just 25 minutes up the highway, and yet up until 2016, they were a rare occurrence here.
When the wave arrived here, little ol’ Niagara was suddenly the place to be! So, what happened to drive our market into the frenzy that we witnessed over the last two years? The answer is that there were many contributing factors. A shifting demographic from the GTA formed a big piece of the puzzle, as we were seeing more and more people feeding the demand side of things but not the supply. Meaning, we had buyers from the GTA, showing up to the party, who were not selling anything, so the scales were heavily tipped in the sellers’ favour.
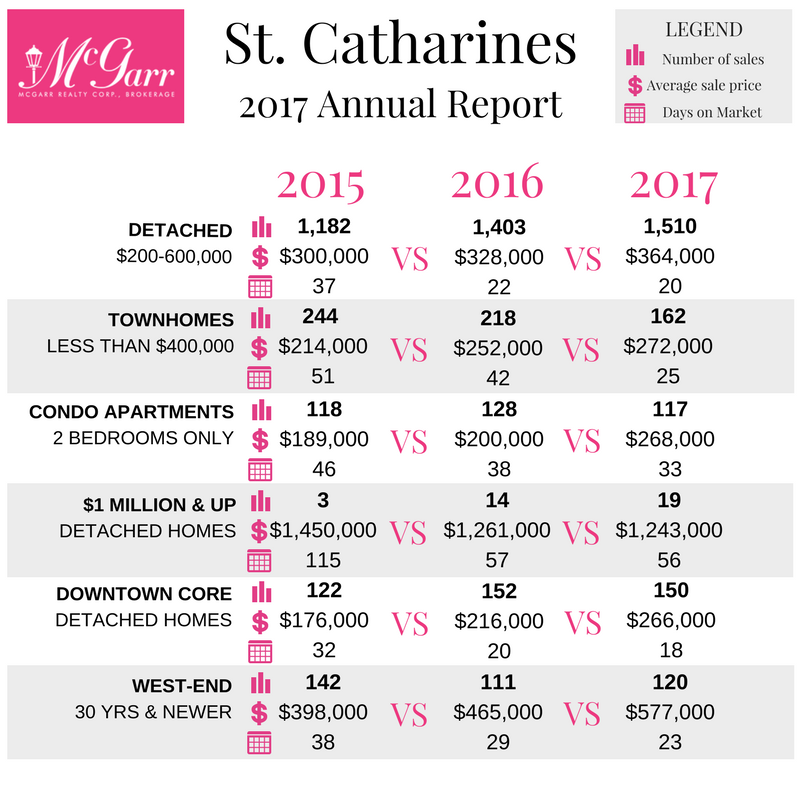
As a result of this frenzy, delayed presentations and multiple offers became a way of life. This phenomenon played out in the stats for 2017, whereby for six straight months, there were over 1,000 detached homes sold in St. Catharines for an average asking price of 102%. This was truly unprecedented.
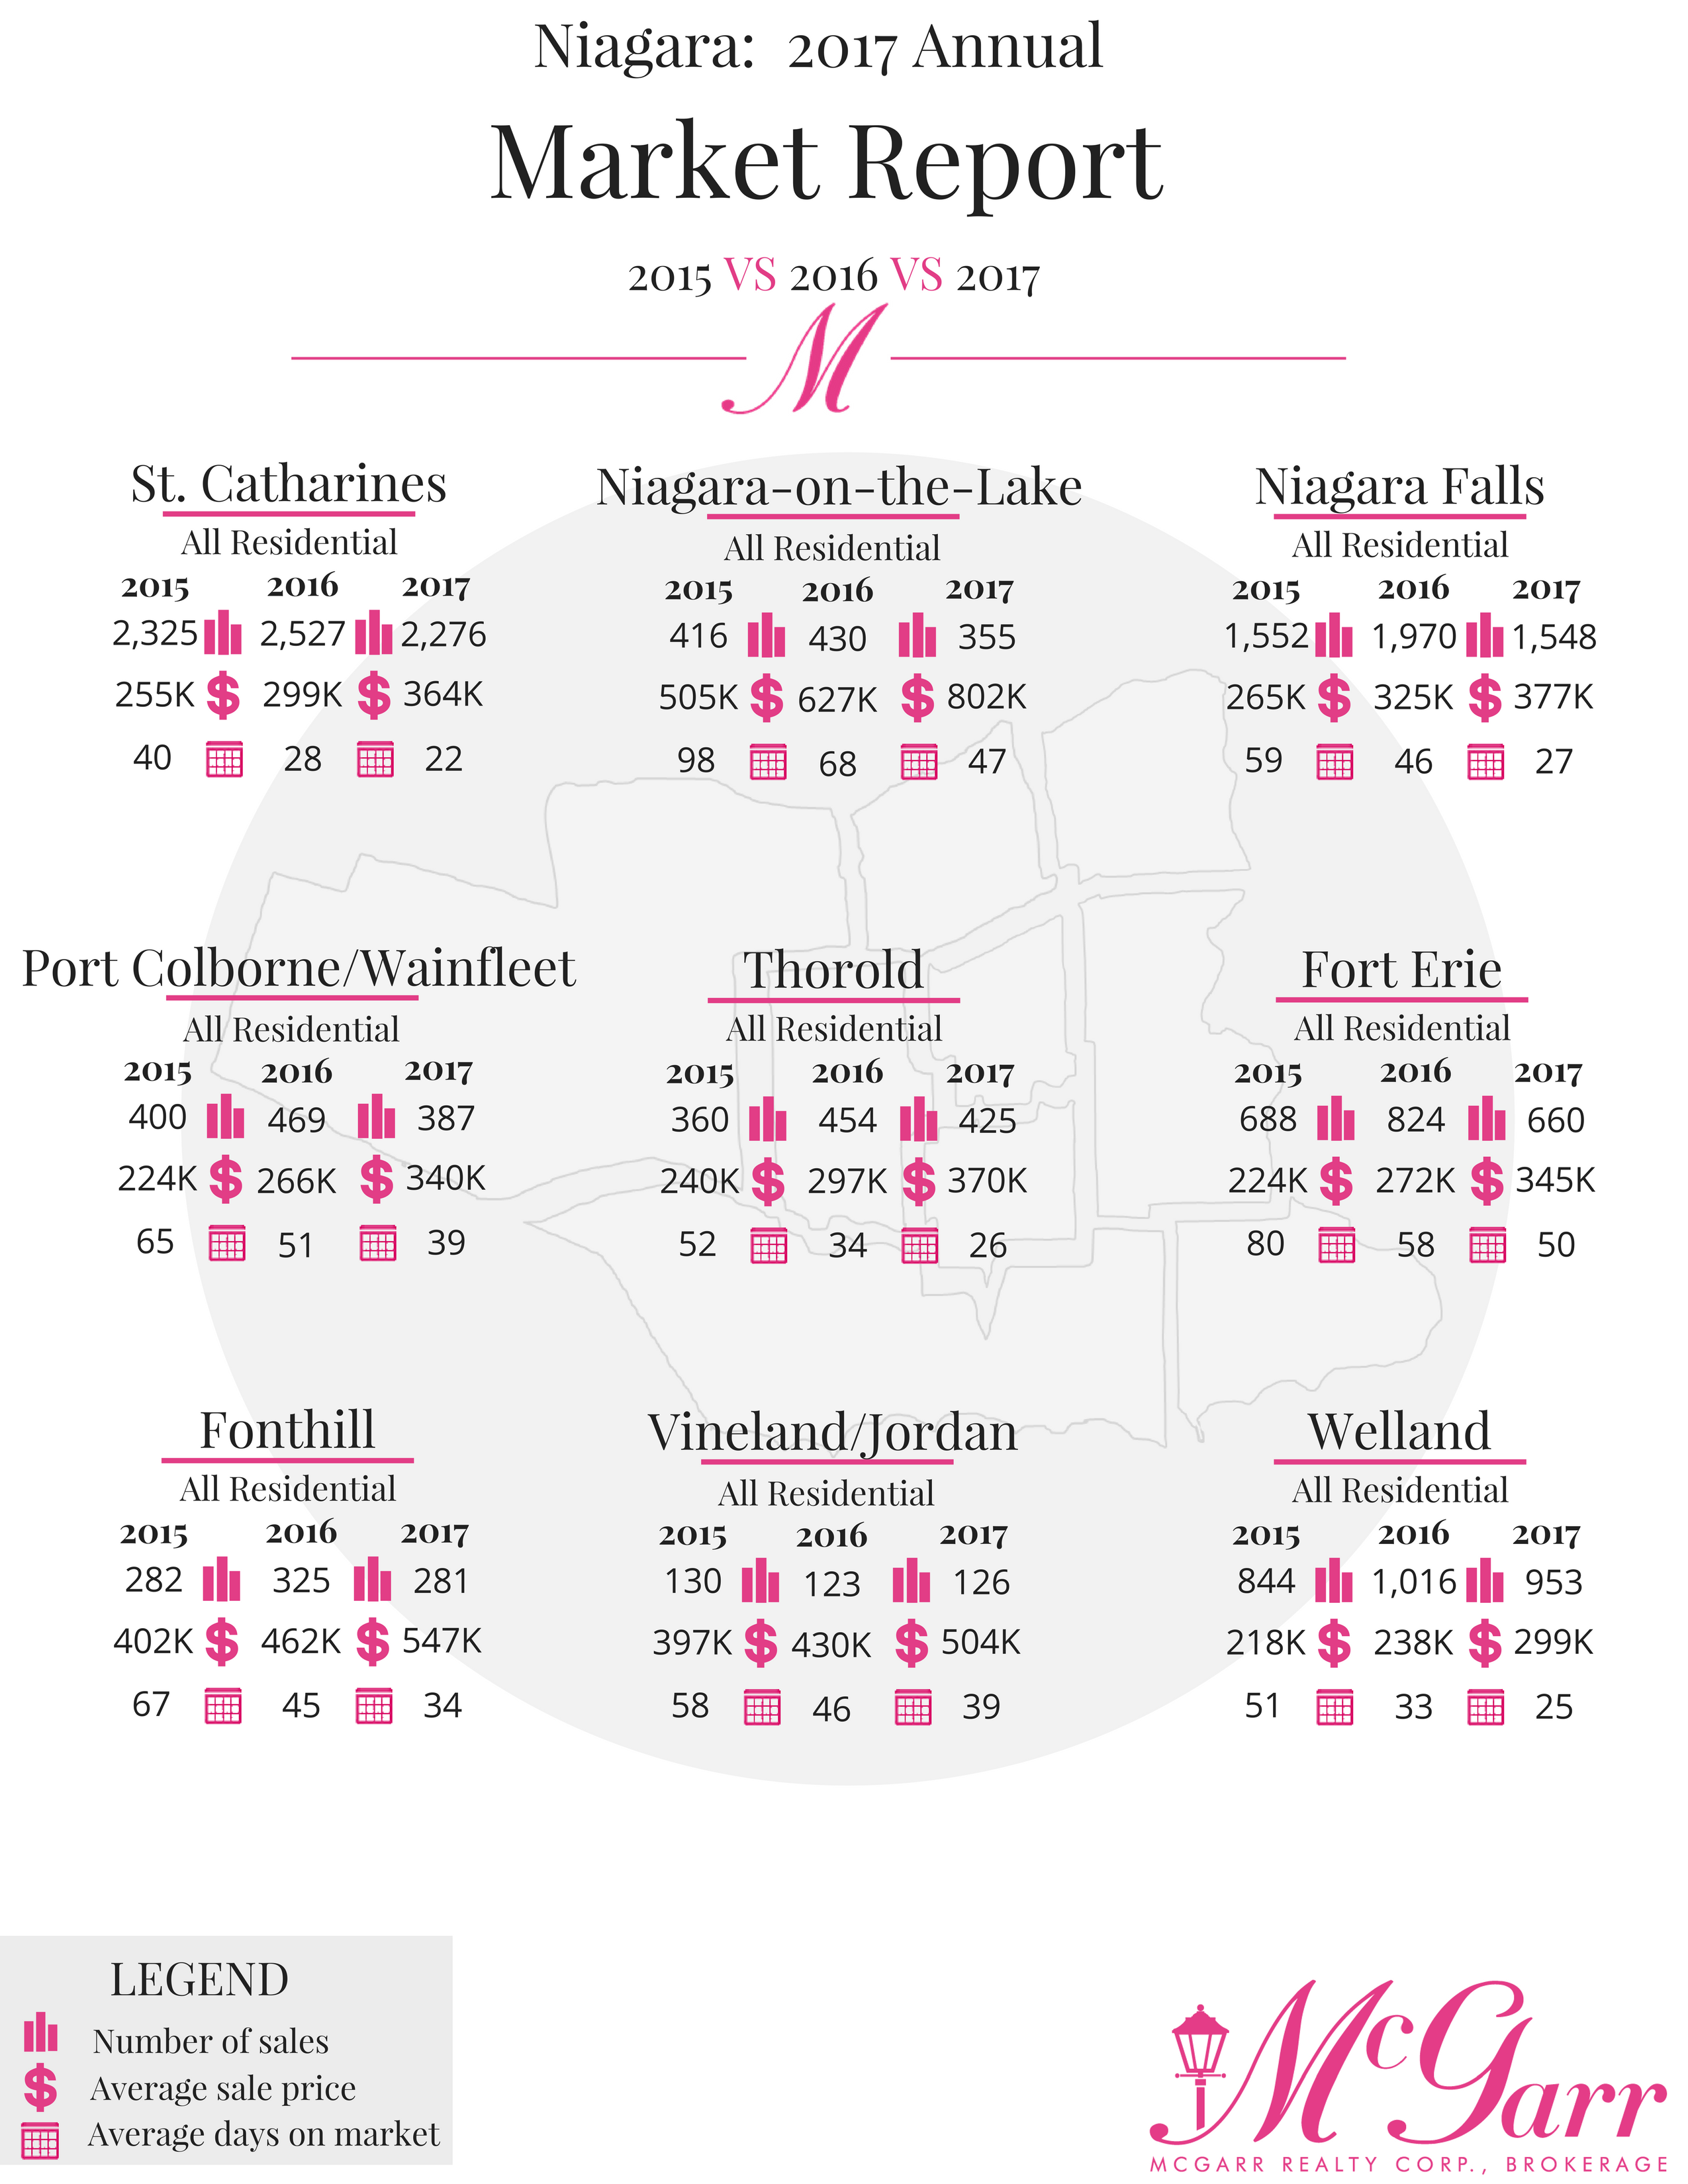
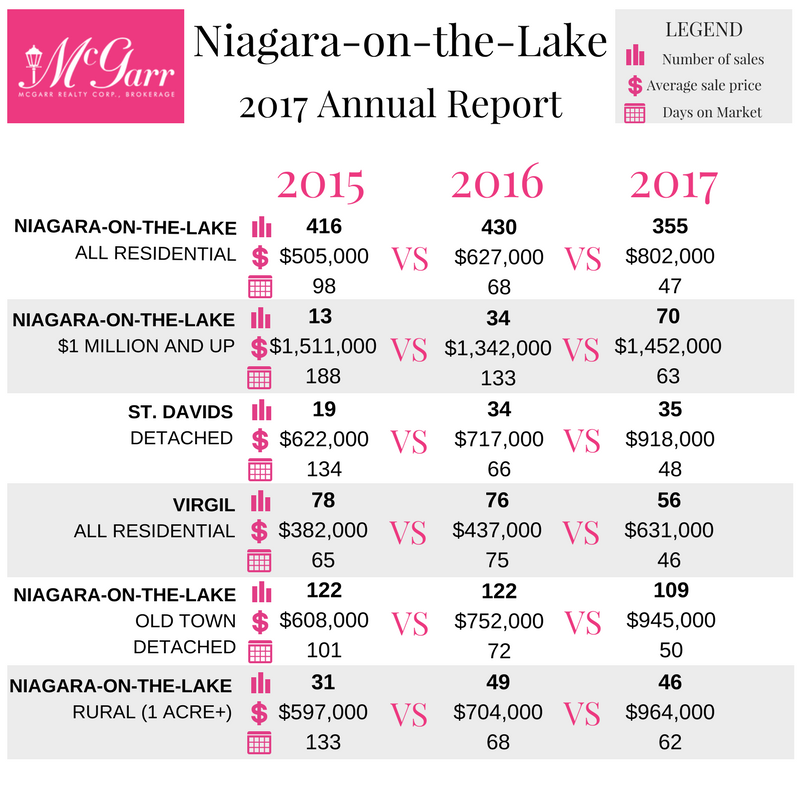
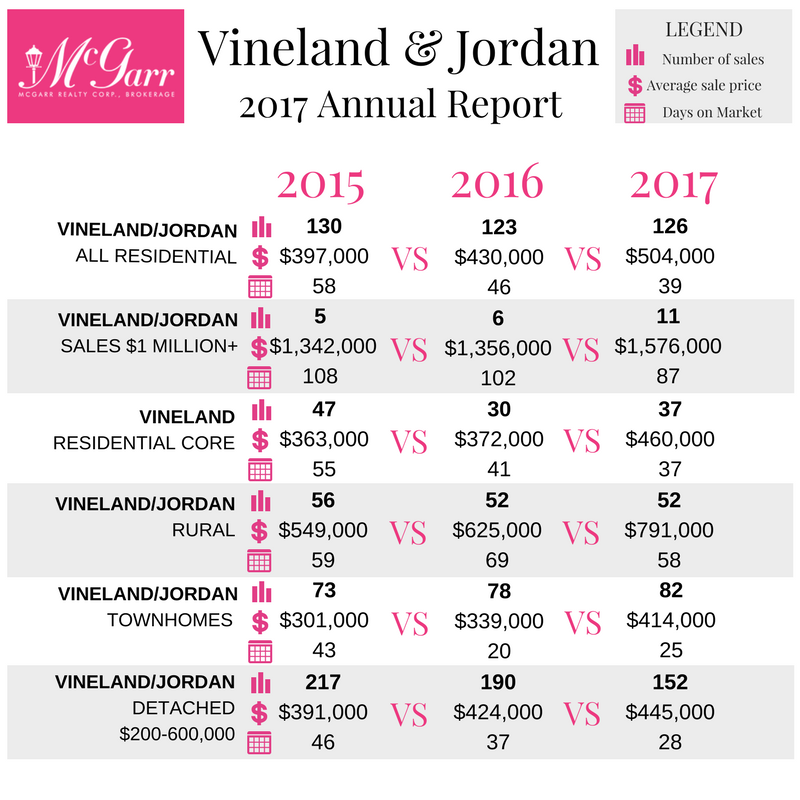
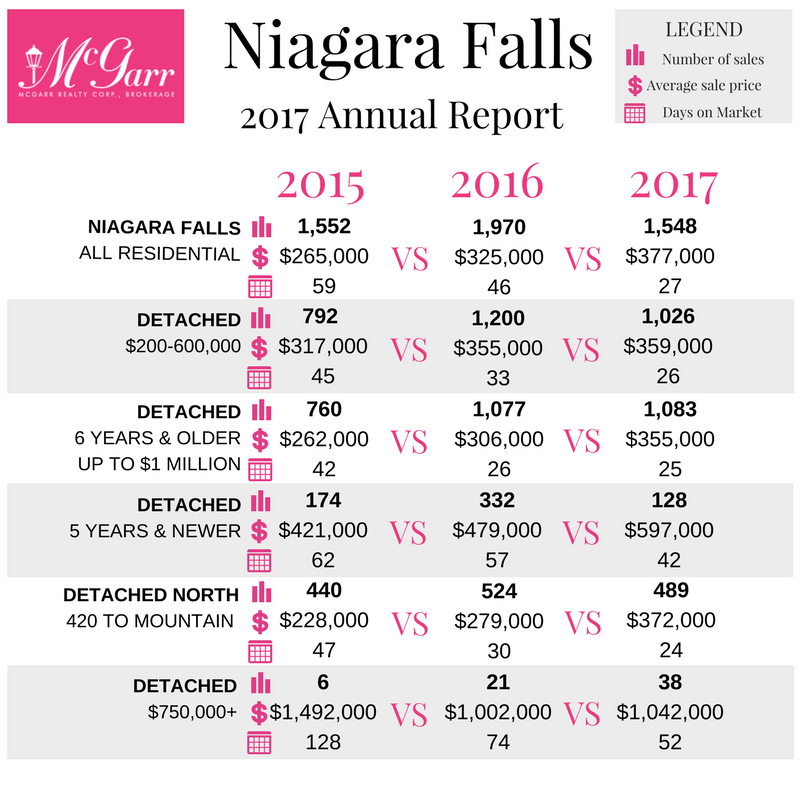
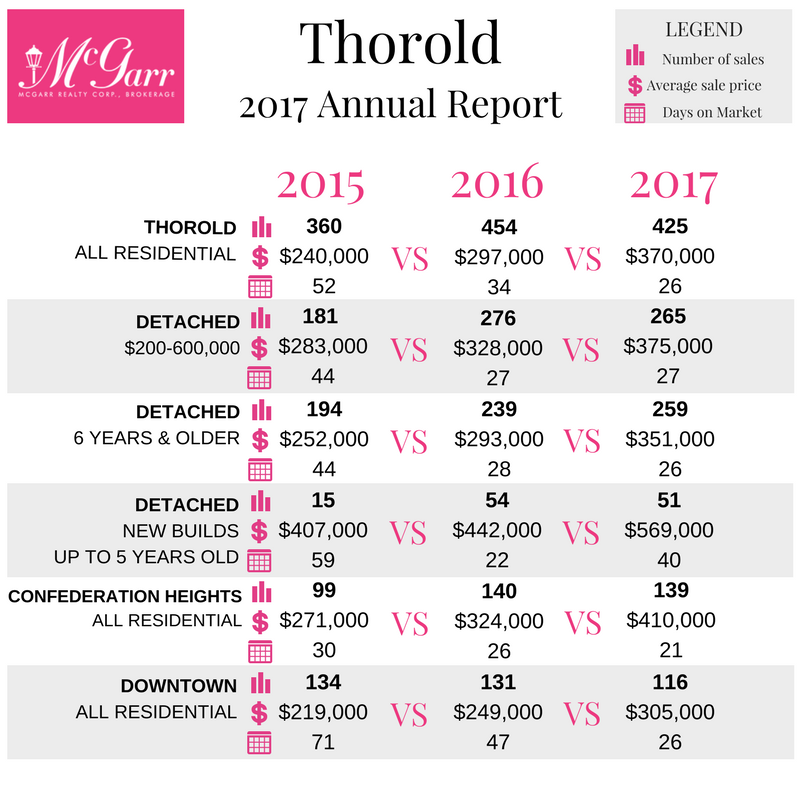
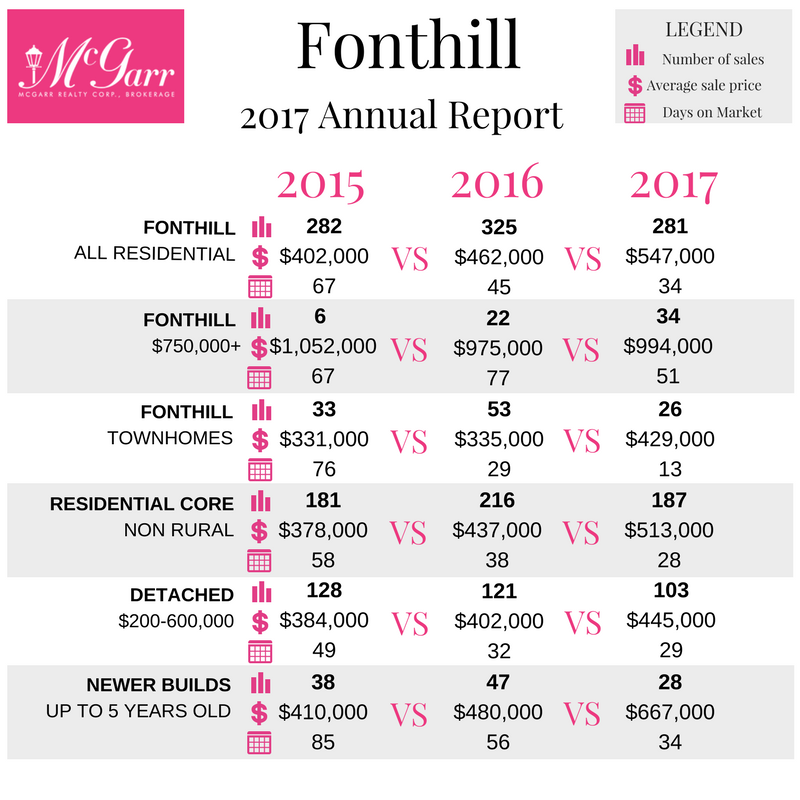
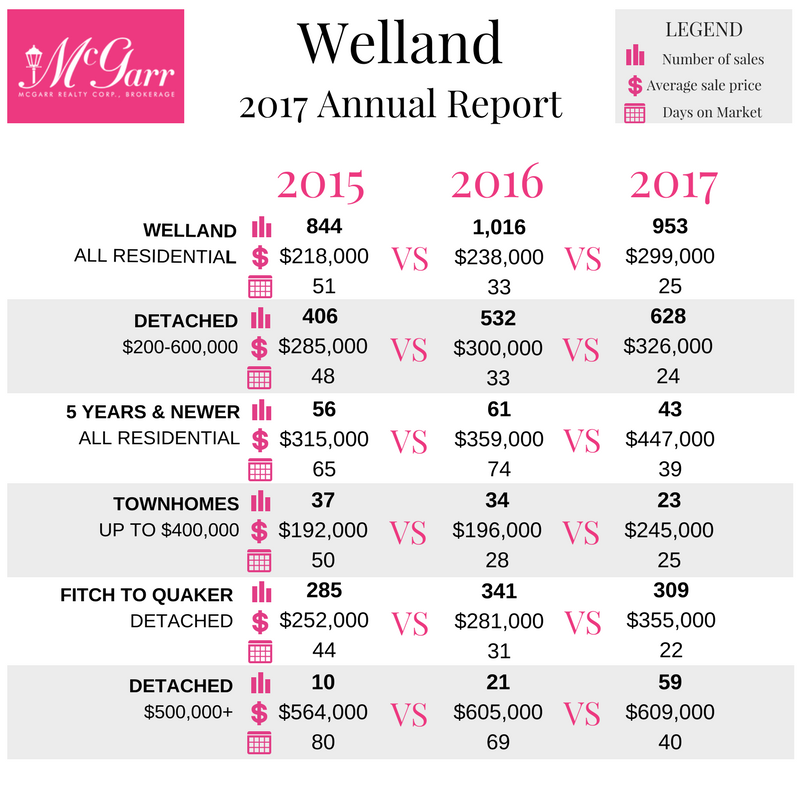
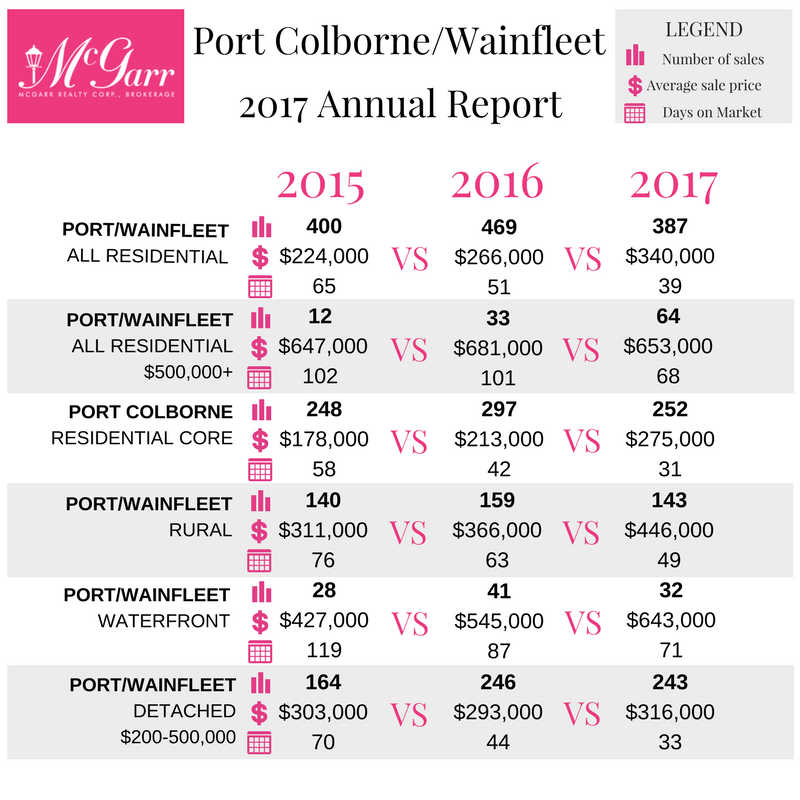
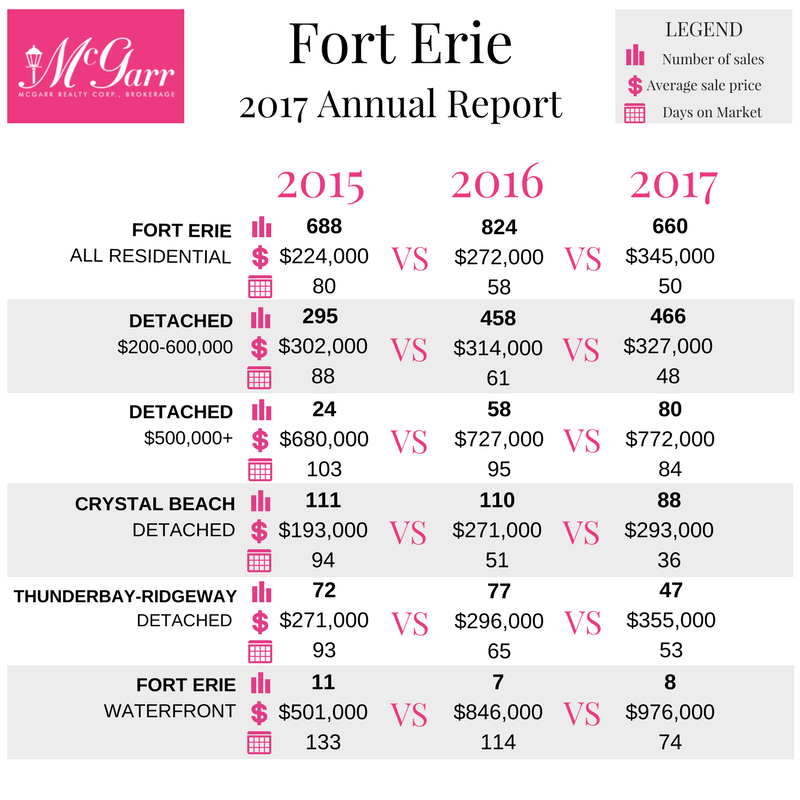
As you look through our city-by- city report, you will see definite trends across all cities and various segments of their respective markets. As with all reports that you review, always consider which numbers are being compared, as the comparison needs to be based on ‘apples to apples’ and not ‘apples to volleyballs’.
1. Average sale prices were up from 2015 to 2016 and then increased more significantly from 2016 to 2017.
2. The total number of sales increased from 2015 to 2016 and then steadied in 2017.
3. The total days on the market declined steadily from 2015 through 2017.
As a further note, the city-by- city reports were broken down individually, in order to show more relevant data for each city. If you would like to discuss the report, the real estate market, or your personal real estate needs, please do not hesitate to contact one of our McGarr Realtors who would be more than happy to help you.
The Latest